SaaS CAC Payback Period: Formula, Example and Benchmarks
Learn how long it takes to recover SaaS acquisition costs, why gross margin matters and how to interpret payback alongside retention and cash timing.

SaaS CAC payback period estimates how many months of customer gross profit are needed to recover customer acquisition cost. A common calculation divides CAC by monthly revenue per account multiplied by gross margin.
The result helps a team assess the pace of acquisition-cost recovery. It is not a promise that every customer will stay long enough to pay back, a bank-balance forecast or proof that the whole company is profitable. Those distinctions become important when acquisition spending grows faster than cash returns.
This article shows the calculation, an illustrative example and the checks needed before using payback to make marketing decisions.
How to calculate SaaS CAC payback period
Use this gross-margin-adjusted formula: CAC payback period in months = CAC ÷ (monthly average revenue per account × gross margin). Enter gross margin as a decimal: 75% becomes 0.75.
ChartMogul’s CAC payback reference uses this formula. The monthly revenue unit matters: an annual revenue input produces an annual result unless it is first normalized to a month. Make the units explicit in the report.
For this calculation, monthly revenue multiplied by gross margin represents monthly gross profit per account. Gross profit remains available to cover acquisition and other expenses after the costs included in cost of revenue. It is not the same as net profit or cash received that month.
A constant monthly amount makes the calculation easy to interpret. Actual customer revenue, service costs and account survival can change. Use the simple result as a starting estimate and examine the underlying cohort when those changes are material.
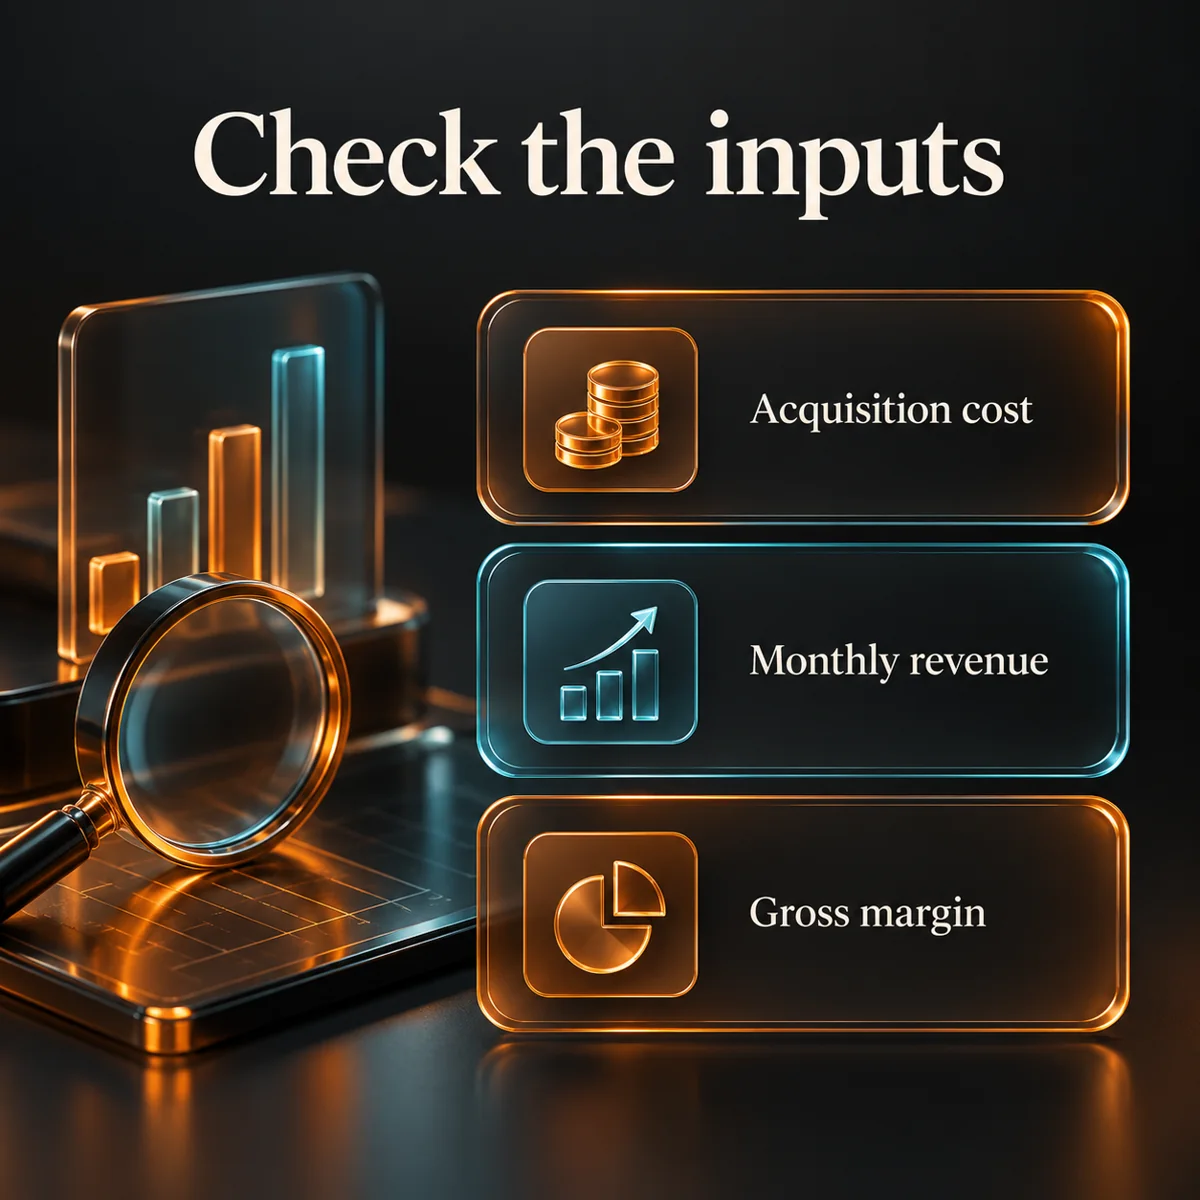
Choose inputs that describe the same customers
Begin with a documented CAC definition. Include the sales and marketing costs attributable to acquiring new paying accounts, using a consistent allocation policy for shared labor, tools, agency support and creative production. A media-only cost per customer is a narrower measure and should be labeled accordingly.
Use revenue per account for the customer segment you acquired. A company-wide average dominated by established enterprise accounts can make payback for newly acquired small accounts look faster than it is. Use account counts consistently rather than switching between companies, users and paid seats.
Apply a gross-margin assumption appropriate to that segment and period. Hosting, support, payment processing and other delivery costs need a consistent accounting treatment. If high-usage customers have materially different service costs, a single company margin can hide the difference.
Match acquisition spending and outcomes sensibly. A period CAC can serve as a regular monitoring metric, but a long sales cycle means current spending and current wins are not necessarily the same acquisition cohort. Record how sales-cycle lag and shared costs were handled.
A worked CAC payback example
The following is a fictional teaching example, not a Scalematix client result or an industry benchmark. Assume a defined acquisition cohort costs $48,000 in allocated sales and marketing spending and produces 20 new paying accounts. Each account starts at $200 in monthly recurring revenue, with a 75% gross margin.
CAC = $48,000 ÷ 20 = $2,400 per new paying account. Monthly gross profit per account = $200 × 0.75 = $150. Estimated CAC payback = $2,400 ÷ $150 = 16 months.
That estimate assumes a customer continues producing $150 of monthly gross profit throughout the recovery period. At cohort level, the corresponding starting monthly gross profit is 20 × $150 = $3,000. Dividing $48,000 by $3,000 gives the same 16-month estimate under the same assumptions.
A revenue-only calculation would divide $2,400 by $200 and report 12 months. It ignores the cost of delivering the service and therefore describes a different, more optimistic recovery measure. Label any revenue-only version clearly rather than comparing it with a gross-margin-adjusted benchmark.
Now change only gross margin to 60%. Monthly gross profit becomes $120 and estimated payback becomes 20 months. Alternatively, reducing CAC to $1,800 while retaining the original $150 monthly gross profit gives 12 months. These are sensitivity calculations, not predicted outcomes or recommendations to cut service quality.
What is a good SaaS CAC payback period?
A shorter period generally reduces the time acquisition investment takes to recover, provided customer quality and the measurement definition remain comparable. There is no threshold that is automatically healthy for every product or customer segment.
ChartMogul describes under roughly 12 months for SMB-focused SaaS and 12–24 months for enterprise SaaS as commonly cited conventions. Its reference also cautions that these are not hard rules. They are contextual reference points, not a measured benchmark for your particular company.
A self-serve product with small contracts, short customer lifetimes and limited available cash faces different constraints from a larger-contract product with a long buying cycle. Do not apply an enterprise convention to a self-serve cohort simply because it makes the result look acceptable.
Set an internal limit using your own retention evidence, delivery economics and financing capacity. Then compare like with like: the same cost scope, revenue units, margin basis and customer segment. A payback figure calculated from advertising spend alone is not directly comparable with fully allocated acquisition spending.
Check whether the cohort actually recovers its cost
The simple formula holds monthly gross profit constant. It does not explicitly model churn, contraction, expansion, discounts ending or delayed activation. A customer who leaves before the modeled recovery date will contribute less than the estimate assumes.
For a stronger historical check, group new customers by acquisition cohort. Track the gross profit generated by that original group each month, including losses from churn or contraction and gains from expansion. Add those monthly amounts cumulatively and compare the total with the acquisition cost allocated to the cohort.
The observed payback month is the point at which cumulative cohort gross profit reaches that cost. If it has not happened by the latest observed month, report “not yet recovered” and the observation horizon. Do not silently treat a forecasted date as an observed result.
For example, a fictional cohort with $48,000 of acquisition costs and only $30,000 of cumulative gross profit after 16 months has not recovered its cost at month 16, even if its starting-revenue formula originally estimated that date. The difference calls for investigation rather than a more favorable label.
If you project later months, show the assumptions separately from observed performance. Use a slower-recovery scenario with weaker retention or higher delivery costs. Avoid assuming that expansion will rescue the cohort without evidence that comparable customers expand.

Payback period is not the same as cash recovery
An annual prepayment brings cash in earlier than monthly collection, but it also creates future service obligations. Normalized monthly subscription revenue and gross profit do not suddenly become twelve times larger because a customer pays the annual invoice upfront.
Build a separate cash view when funding decisions depend on timing. Include when acquisition invoices and commissions are paid, when customer payments are collected, refunds or credits and the cash cost of serving customers. State whether you measure from the start of acquisition spending or from the customer’s first paid month.
A sales process can consume cash before a customer signs. The basic post-acquisition monthly-margin formula does not display that pre-sale timing. Nor does it capture every operating expense, tax, debt payment or future reinvestment need.
Keep the gross-profit payback estimate and the cash forecast together, with distinct labels. This gives marketing a consistent acquisition measure and finance a view of the actual funding gap.
How to improve payback without hiding the problem
First identify the driver. If acquisition cost rose, inspect channel mix, prospect fit, conversion progression and sales effort. If revenue per new account fell, examine discounting, plan mix and the customers being acquired. If margin fell, investigate delivery cost and service intensity before blaming the media budget.
Test one justified change against customer outcomes. Better qualification may reduce sales work; clearer onboarding may help accounts realize value sooner; a pricing change may alter revenue and conversion together. None of these automatically improves economics, so monitor the downstream result.
Do not manufacture a faster number by excluding acquisition salaries, moving costs between categories without explanation or replacing new-customer revenue with the richer average of older customers. Keep the definition stable and disclose genuine methodology changes.
Review retention alongside payback. Cutting onboarding assistance may reduce acquisition-related spending but weaken early adoption. Raising prices may increase revenue per account while changing win rates or churn. Evaluate the full tradeoff instead of optimizing one cell in a dashboard.
CAC payback period vs LTV:CAC
CAC payback asks how long acquisition-cost recovery takes. LTV:CAC compares estimated customer lifetime value with acquisition cost. Stripe’s payback explainer discusses these as different views of acquisition economics.
A favorable lifetime ratio can coexist with a slow recovery timeline. That can create a funding challenge even if the lifetime assumptions eventually prove correct. A short payback period can also coexist with limited remaining customer value if accounts leave soon afterward.
Use both measures with clearly defined gross-margin and retention assumptions. Then examine customer cohorts, available cash and the uncertainty in any lifetime forecast before increasing acquisition spending.
Common questions about SaaS CAC payback
Does reaching payback mean the business is profitable? No. It means the acquisition-cost measure has been recovered under the stated gross-profit definition. Other operating expenses and obligations remain outside that calculation.
What happens if gross margin is zero or negative? The simple formula does not produce a meaningful positive recovery timeline. Report that the assumed monthly gross profit cannot recover CAC and investigate the economics. Do not present zero months as the answer.
Should annual revenue be divided by 12? Use a monthly normalized recurring-revenue input for a result expressed in months. Keep one-time fees and their associated delivery costs separate unless the model explicitly incorporates them consistently.
Can payback be compared across channels? Yes, with consistent cost allocation and enough time for conversion and customer performance to emerge. Show segment mix and sample size, and distinguish an early estimate from an observed recovery result.
Make acquisition reporting useful for decisions
Read SaaS Marketing: The Complete Guide for the wider connection between acquisition, product value and retention. A payback number becomes useful when it helps the team decide what to investigate or test next.
Explore Scalematix’s growth strategy services or contact Scalematix to discuss how your acquisition plan and measurement approach can support better growth decisions.
Let’s make
your next move.
LET’S TALK
Bring your ambition.
We’ll bring a different perspective.